Chapter 10: Remote Sensing and Earth Observation

Remote sensing measures Earth from a distance. Earth observation systems convert repeated sensor measurements into scientific and operational knowledge about land, water, atmosphere, cities, agriculture, hazards, and climate.
Companion visual reference: Spatial Data Structure Visual Atlas
Learning Goals
- Explain passive, active, multispectral, hyperspectral, thermal, SAR, and LiDAR sensing.
- Understand spatial, spectral, temporal, and radiometric resolution.
- Build basic remote sensing workflows for preprocessing, indexing, classification, and change detection.
- Use cloud-native imagery and catalogs responsibly.
Theory
Remote sensing is measurement, not photography. Sensors record reflected or emitted energy in spectral bands. The same location can look different because of season, atmosphere, sun angle, sensor calibration, clouds, moisture, and land-cover change.
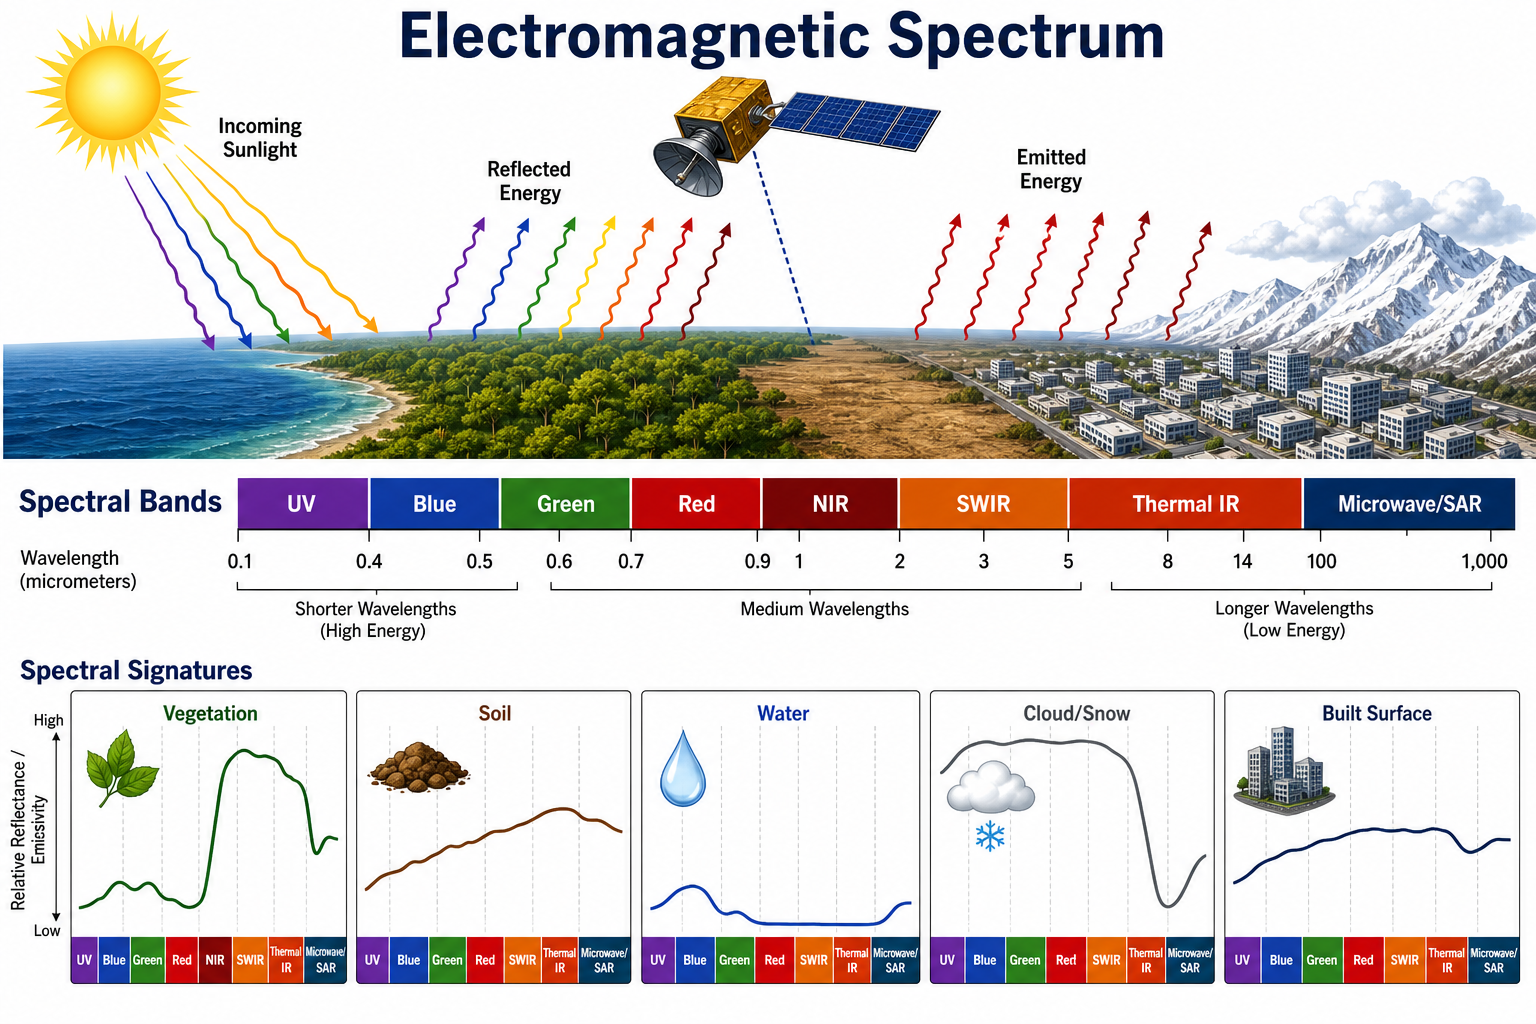
Every remotely sensed image is a stack of measurements. A normal-looking satellite image may combine red, green, and blue bands so it resembles human vision, but the real analytical power comes from wavelengths outside human sight. Healthy leaves absorb red light for photosynthesis and strongly reflect near infrared energy. Water absorbs near infrared and shortwave infrared energy. Dry soil, minerals, snow, ash, concrete, algae, aerosols, and clouds each produce different spectral patterns. Those patterns are called spectral signatures.
flowchart LR
    A[Sunlight or emitted energy] --> B[Atmosphere]
    B --> C[Surface or volume interaction]
    C --> D[Reflected, absorbed, scattered, or emitted energy]
    D --> E[Sensor bands]
    E --> F[Calibrated pixel values]
    F --> G[Spectral signature]
    G --> H[Indices, classification, change detection, or physical retrieval]
Remote sensing is therefore a problem of physics, calibration, and interpretation. A pixel value is not "crop health" or "water quality" by itself. It is a measured response in a wavelength range. Analysts turn those measurements into information by comparing bands, using field observations, applying atmospheric correction, checking metadata, and validating results against independent data.
Operational Earth observation depends on repeatability: known sensors, known orbits, calibrated products, metadata, and analysis-ready data.
Field reality capture extends the same measurement discipline to short-range work. Drones, mobile phones, action cameras, terrestrial cameras, LiDAR scanners, and vehicle-mounted sensors can document bridges, substations, culverts, construction sites, fire damage, landslides, and building interiors. Gaussian Splatting is especially relevant when inspection users need photorealistic scene review rather than only orthophotos, point clouds, or meshes.
Electromagnetic Wavelengths and What They Reveal
The exact wavelength ranges vary by sensor, but the general pattern is stable enough to guide design:
| Region | Approximate wavelength | Common remote sensing meaning | Example uses |
|---|---|---|---|
| Ultraviolet | 0.1-0.4 micrometers | Atmospheric scattering, aerosols, ozone, fluorescence | Air quality, atmospheric chemistry, oil or organic fluorescence in specialized sensors |
| Blue | 0.45-0.52 micrometers | Water penetration, haze sensitivity, shallow water, visible color | Bathymetry in clear water, sediment, coral reef mapping, atmospheric correction |
| Green | 0.52-0.60 micrometers | Vegetation reflectance peak, chlorophyll response, visible water color | Crop vigor, algal bloom screening, true-color imagery |
| Red | 0.63-0.69 micrometers | Chlorophyll absorption, vegetation stress, turbidity | NDVI, crop monitoring, sediment-rich water |
| Red edge | 0.70-0.75 micrometers | Transition between red absorption and NIR reflectance | chlorophyll concentration, early crop stress, precision agriculture |
| Near infrared (NIR) | 0.75-1.3 micrometers | Leaf structure, biomass, water/land separation | Vegetation vigor, wetlands, shoreline mapping |
| Shortwave infrared (SWIR) | 1.3-2.5 micrometers | Moisture, minerals, snow/cloud separation, burn scars | Drought, soil and vegetation moisture, geology, fire severity |
| Thermal infrared | 8-14 micrometers | Emitted heat, surface temperature, heat capacity | Urban heat, evapotranspiration, drought stress, wildfire hotspots |
| Microwave / SAR | millimeters to meters | Surface roughness, structure, water, dielectric properties; can penetrate clouds | Flood mapping, soil moisture, forest structure, ice, deformation |
Hyperspectral and imaging spectroscopy systems measure many narrow bands rather than a few broad bands. That matters for chemicals and minerals because narrow absorption features can indicate materials such as iron oxides, clays, carbonates, vegetation pigments, liquid water, snow grain properties, methane, and some pollutants. Even then, remote sensing usually estimates probability, abundance, or concentration proxies; it does not replace field sampling, laboratory analysis, or regulatory monitoring.
Spectral Signatures
A spectral signature is the shape of reflectance, radiance, backscatter, or emitted energy across wavelengths. Different materials have different shapes:
- Healthy vegetation: low red reflectance, high NIR reflectance, moisture-sensitive SWIR response.
- Dry or bare soil: generally increasing visible-to-SWIR reflectance, modified by organic matter, iron oxides, clay, salinity, roughness, and moisture.
- Clear water: low NIR and SWIR reflectance, with blue/green penetration depending on depth and clarity.
- Turbid or algae-rich water: stronger visible reflectance, especially green/red features related to sediment, chlorophyll, and colored dissolved organic matter.
- Snow and clouds: bright in visible wavelengths, but SWIR helps separate snow, ice, and liquid-water clouds.
- Burned land: lower NIR and changed SWIR response because canopy structure, charcoal, ash, and moisture have changed.
- Built surfaces: mixed signatures from asphalt, concrete, metal, roofing, glass, shadows, heat, and geometry.
The same material can change signature with moisture, angle, grain size, canopy density, depth, atmosphere, or sensor calibration. This is why good workflows keep acquisition metadata close to the data.
Vegetation and Moisture Indices
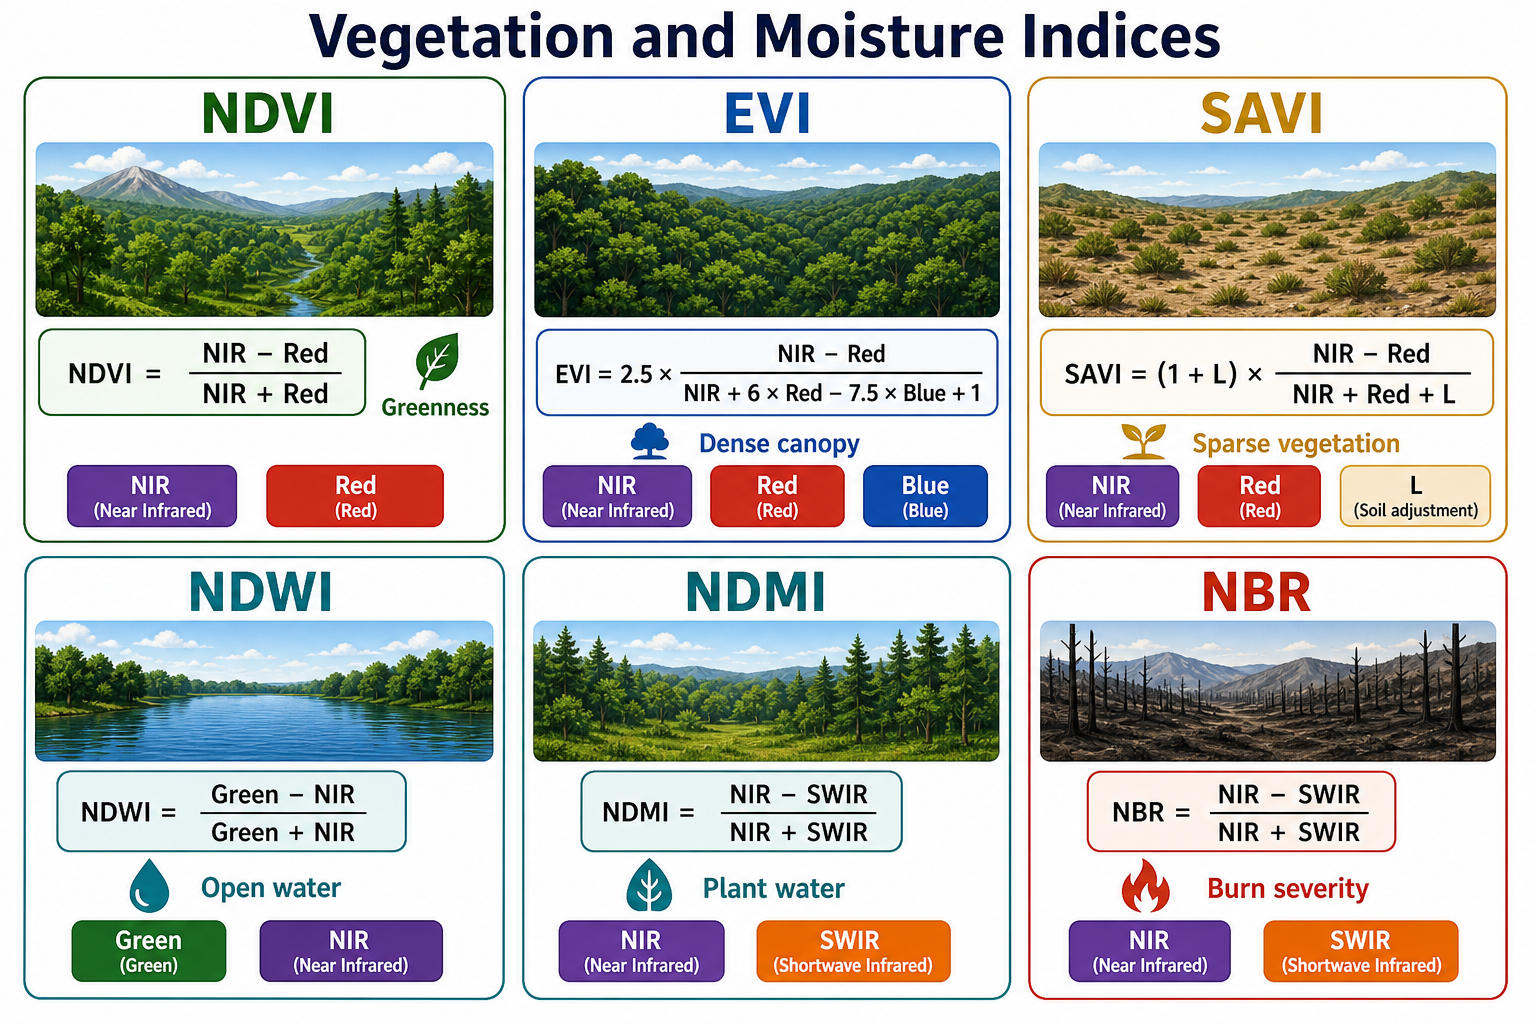
Vegetation indices are compact band-math summaries. They are useful because they reduce large image stacks into interpretable layers, but they are still proxies. High NDVI often means vigorous green vegetation, but it can saturate in dense forests, fail under clouds and shadows, and mislead when soil, season, crop type, or atmosphere are ignored.
| Index | General formula | Wavelengths used | What it usually means | Common industries |
|---|---|---|---|---|
| NDVI | (NIR - Red) / (NIR + Red) |
Red, NIR | Green vegetation vigor, biomass proxy, photosynthetic activity | Agriculture, forestry, conservation, drought monitoring |
| EVI | 2.5 * (NIR - Red) / (NIR + 6*Red - 7.5*Blue + 1) |
Blue, Red, NIR | Vegetation signal with improved behavior in dense canopy and some atmospheric/soil correction | Global vegetation monitoring, forestry, carbon and climate studies |
| SAVI | ((NIR - Red) / (NIR + Red + L)) * (1 + L) |
Red, NIR, soil factor | Vegetation in sparse-cover areas where soil brightness matters | Dryland agriculture, rangelands, reclamation, arid environments |
| MSAVI | sensor-specific variants | Red, NIR | Soil-adjusted vegetation without manually choosing L |
Sparse crops, rangelands, early-season fields |
| GNDVI | (NIR - Green) / (NIR + Green) |
Green, NIR | Chlorophyll and nitrogen-related vegetation response | Precision agriculture, nutrient management |
| NDRE | (NIR - RedEdge) / (NIR + RedEdge) |
Red edge, NIR | Chlorophyll in dense vegetation; often more sensitive than NDVI after canopy closure | Precision agriculture, vineyards, orchards, forestry |
| NDWI / NDMI | (NIR - SWIR) / (NIR + SWIR) |
NIR, SWIR | Vegetation liquid water or canopy moisture | Irrigation, drought, wildfire risk, forestry |
| NDWI for open water | (Green - NIR) / (Green + NIR) |
Green, NIR | Open water enhancement and land/water separation | Flood mapping, surface water monitoring, wetlands |
| MNDWI | (Green - SWIR) / (Green + SWIR) |
Green, SWIR | Open water in built-up areas where NIR water indices confuse shadows or buildings | Urban flood mapping, reservoirs, coastal monitoring |
| NBR | (NIR - SWIR) / (NIR + SWIR) |
NIR, SWIR | Burn severity and vegetation loss when compared before and after fire | Wildfire recovery, emergency management, forestry |
The repeated use of NIR and SWIR in several indices is not a typo. Vegetation, water content, and burn severity all affect leaf/canopy structure and moisture, so similar bands can support different interpretations depending on timing, context, and the change being measured.
Environments, Chemicals, and Materials
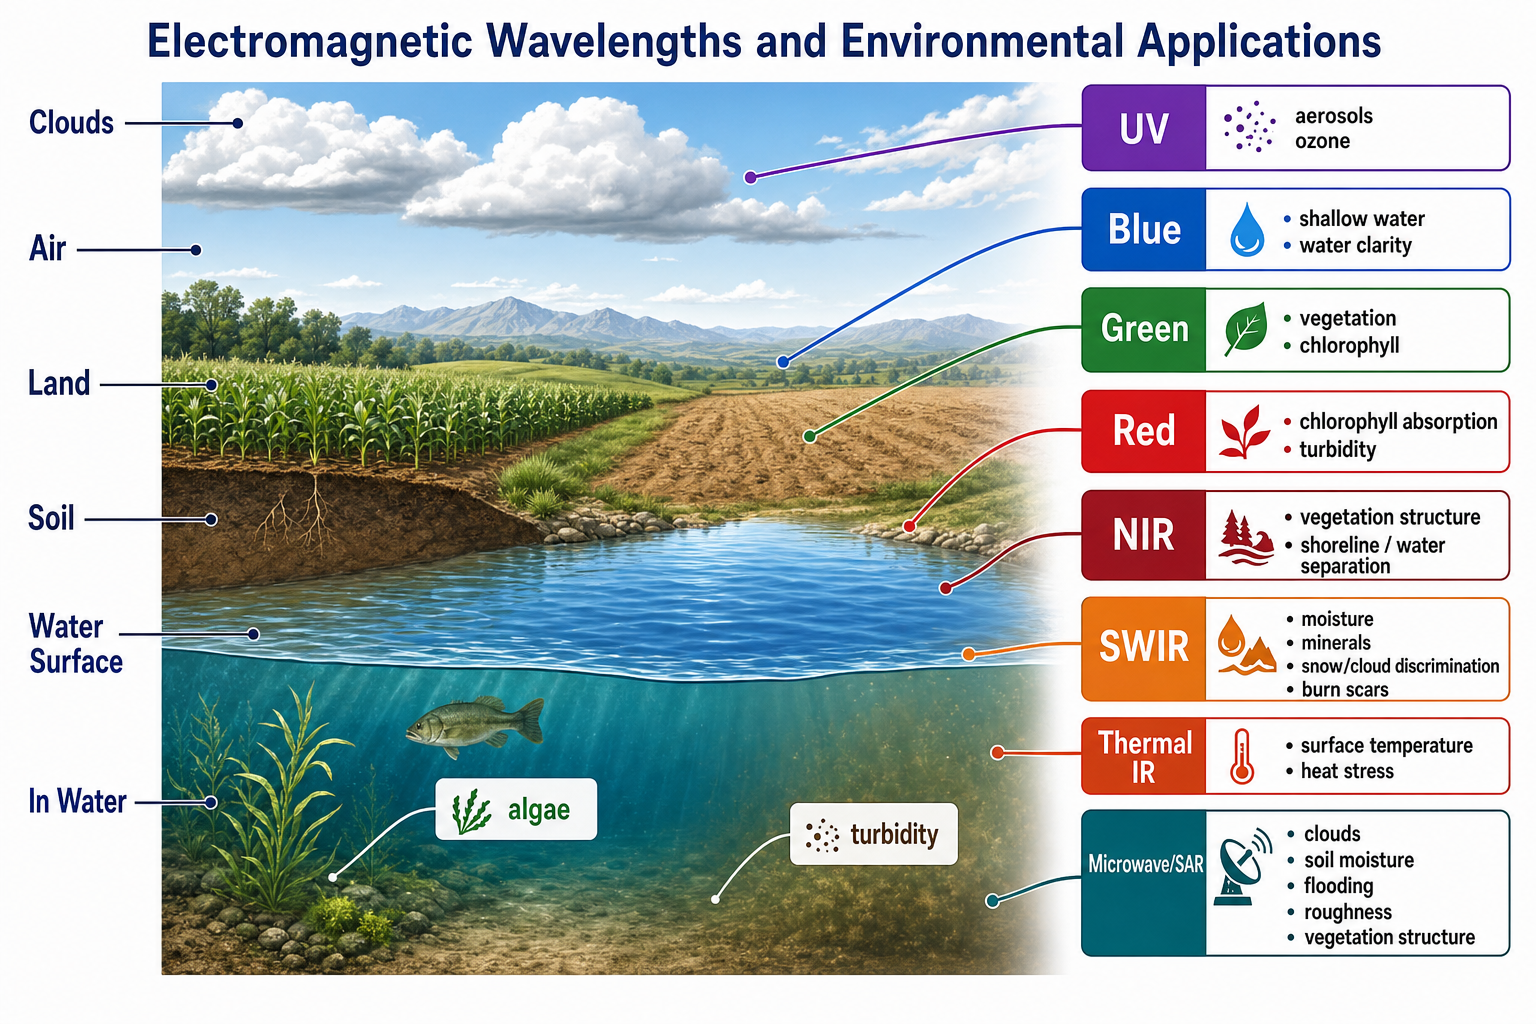
Remote sensing can detect or infer many materials and environmental conditions, but the language matters. Broad multispectral data usually detects indicators such as greenness, moisture, turbidity, heat, burn scars, or mineral groups. Hyperspectral data can sometimes identify more specific minerals, gases, pigments, or chemical absorption features. Radar detects structure, roughness, geometry, and dielectric response rather than color.
| Environment | What can be sensed | Useful wavelengths or sensors | Interpretation notes |
|---|---|---|---|
| Clouds | Cloud cover, cloud phase, cloud-top temperature, snow/cloud separation | Visible, SWIR, thermal IR, microwave | Clouds block many optical observations; radar can often observe through clouds. |
| Air / atmosphere | Aerosols, smoke, ozone, water vapor, methane, dust composition | UV, visible, SWIR, thermal IR, hyperspectral spectrometers | Atmospheric correction is required before many land/water products are trustworthy. |
| Land vegetation | Chlorophyll, canopy structure, stress, phenology, biomass proxies | Green, red, red edge, NIR, SWIR, thermal IR, SAR | Field validation is needed because species, season, soil, and moisture can mimic stress. |
| Soil | Moisture, brightness, salinity indicators, organic matter proxies, iron oxides, clays, carbonates | Visible, NIR, SWIR, thermal IR, microwave/SAR, hyperspectral | Vegetation cover hides soil; hyperspectral SWIR is important for mineral groups. |
| Built environment | Impervious surface, roofing materials, heat islands, construction change | Visible, NIR, SWIR, thermal IR, SAR, LiDAR | Shadows and mixed pixels are major problems in cities. |
| Water surface | Open water, turbidity, chlorophyll-a proxies, sediment, oil sheen in specialized cases, surface temperature | Blue, green, red, NIR, SWIR, thermal IR, SAR, hyperspectral | Water products depend strongly on atmospheric correction, sun glint, depth, and suspended material. |
| In water | Shallow bathymetry, submerged aquatic vegetation, coral, algae, suspended sediment | Blue, green, red, hyperspectral visible bands | Light attenuates rapidly in water; NIR and SWIR are mostly absorbed by water. |
| Snow, ice, and glaciers | Snow cover, grain size, melt state, debris cover, ice velocity | Visible, NIR, SWIR, thermal IR, SAR | SWIR is especially useful for separating snow from clouds and mapping melt. |
| Fire and heat | Active fire, burn severity, vegetation loss, soil exposure, recovery | Thermal IR, NIR, SWIR, SAR | Active fire and burn severity use different measurements and time windows. |
Industry Patterns
| Industry or mission | Common questions | Common bands, indices, or sensors |
|---|---|---|
| Agriculture | Which fields are stressed, overwatered, under-fertilized, or ready for harvest? | NDVI, EVI, SAVI, GNDVI, NDRE, NDMI, thermal IR, SAR soil moisture |
| Forestry | Where are canopy loss, disease, drought stress, fire damage, or regrowth happening? | NDVI/EVI time series, NDMI, NBR/dNBR, red edge, LiDAR, SAR |
| Water resources | Where is surface water, flooding, turbidity, algae, or drought? | NDWI, MNDWI, visible water color, thermal IR, SAR flood mapping |
| Environmental regulation | Where are disturbed lands, mine waste, oil sheen, thermal discharge, or sediment plumes? | Hyperspectral, visible/SWIR minerals, thermal IR, SAR, field sampling |
| Disaster response | What changed after flood, fire, storm, landslide, or volcanic eruption? | SAR, NBR/dNBR, NDWI/MNDWI, thermal IR, optical change detection |
| Urban planning | Where are heat islands, impervious surfaces, expansion, or vegetation gaps? | Thermal IR, NDBI-style built indices, NDVI, high-resolution optical, LiDAR |
| Climate and atmosphere | How are vegetation, aerosols, dust, ice, clouds, methane, and heat changing? | MODIS/VIIRS time series, hyperspectral instruments, thermal IR, microwave, SAR |
| Geology and mining | What mineral groups or alteration zones are visible at the surface? | SWIR hyperspectral mineral features, thermal IR, topography, field spectroscopy |
Research and Standards Foundations
Landsat is a model example of why calibration, continuity, and open access matter. NASA describes Landsat as the longest continuous space-based record of Earth's land surface, with observations dating back to 1972. The value is not only image availability; it is the consistent, science-grade record that supports long-term change analysis.
For engineers, this means remote sensing pipelines must preserve acquisition time, sensor, band definitions, processing level, cloud masks, nodata values, spatial resolution, projection, and calibration metadata. A model trained on one sensor, season, or processing level may not generalize to another without harmonization and validation.
Research on vegetation indices shows why band math must be treated as a model. NDVI relies on red chlorophyll absorption and strong NIR vegetation reflectance. SAVI adjusts for soil brightness in sparse vegetation. EVI improves vegetation monitoring in dense canopy and atmospheric contamination settings. Water indices differ by purpose: Gao's NDWI focuses on vegetation liquid water using NIR and SWIR, while McFeeters's NDWI uses green and NIR to enhance open water. Fire mapping commonly compares NBR before and after fire to estimate burn severity.
Math
Key math includes raster grids, band math, atmospheric correction, radiometric calibration, normalized difference indices, convolution, classification, segmentation, time-series analysis, and uncertainty assessment.
NDVI is a classic example:
NDVI = (NIR - Red) / (NIR + Red)
It is useful but not magical. It must be interpreted with sensor, season, land-cover, and atmospheric context.
Other common index formulas:
EVI = 2.5 * (NIR - Red) / (NIR + 6 * Red - 7.5 * Blue + 1)

SAVI = ((NIR - Red) / (NIR + Red + L)) * (1 + L)

NDMI or Gao-style NDWI = (NIR - SWIR) / (NIR + SWIR)

Open-water NDWI = (Green - NIR) / (Green + NIR)

MNDWI = (Green - SWIR) / (Green + SWIR)

NBR = (NIR - SWIR) / (NIR + SWIR)

dNBR = NBR_prefire - NBR_postfire
Additional computation patterns:
raster map algebra:
output[row, col] = f(raster1[row, col], raster2[row, col], ...)

first difference for change detection:
delta_t = x_t - x_(t-1)

multiband data cube:
cube[x, y, band, time] = observed_value

camera projection for field capture:
u = K * (R * X + t)

inspection change:
delta_t = condition_score_t - condition_score_(t-1)
See also: Math and Algorithms Reference
Tools of the Trade
- Landsat, Sentinel, MODIS, VIIRS, NAIP, commercial imagery.
- Imaging spectroscopy and hyperspectral missions/instruments such as EMIT, AVIRIS, EnMAP, PRISMA, and airborne drone hyperspectral sensors.
- SAR and microwave missions such as Sentinel-1, NISAR, SMAP, and commercial SAR constellations.
- NASA Earthdata, USGS EarthExplorer, Copernicus, Google Earth Engine, Microsoft Planetary Computer.
- GDAL, rasterio, xarray, rioxarray, Dask, STAC clients.
- QGIS, SNAP, ENVI, GRASS GIS, Orfeo ToolBox.
- Field capture and reconstruction: drone photogrammetry tools, COLMAP, OpenDroneMap, Gaussian Splatting viewers, LiDAR/mobile mapping tools, ground control points, and field data collection apps.
Examples of Real-World Solutions
- Burn severity mapping after wildfires.
- Crop stress and irrigation monitoring.
- Flood extent mapping.
- Deforestation detection.
- Urban expansion analysis.
- Glacier and snow-cover monitoring.
- Hyperspectral mineral mapping for dust, geology, and mine reclamation.
- Algal bloom and turbidity screening in lakes, reservoirs, and coastal water.
- Urban heat island analysis using thermal infrared surface temperature.
- Field inspection scenes where a drone or mobile capture is processed into a Gaussian Splat so reviewers can revisit asset condition, line-of-sight constraints, surface staining, spalling, vegetation encroachment, or construction progress.
Working Practice Examples
- Find two cloud-free Landsat or Sentinel scenes for the same area and compare land-cover change.
- Calculate NDVI and map high, medium, and low vegetation.
- Mask clouds and explain how cloud contamination affects analysis.
- Create a time-series chart for one location from repeated observations.
- Design a field inspection capture plan for a small asset: camera path, overlap, ground control, safety constraints, metadata, and expected deliverables such as orthomosaic, mesh, point cloud, and Gaussian Splat viewer.
- Compare NDVI, NDMI, and NDRE for the same agricultural field and explain what each index emphasizes.
- Map open water using NDWI and MNDWI, then compare performance in rural and urban areas.
- Create a pre-fire and post-fire NBR map and calculate dNBR classes for burn severity.
- Pick one environmental material such as algae, suspended sediment, iron oxide, clay, snow, or asphalt. Describe which wavelengths should respond and what field validation would be needed.
Common Failure Modes
- Treating imagery as ordinary photos.
- Ignoring clouds, shadows, atmosphere, and seasonality.
- Comparing different sensors without harmonization.
- Forgetting nodata masks.
- Over-interpreting classification maps without validation.
- Treating a vegetation index as direct proof of crop yield, disease, nutrient status, or a specific chemical.
- Mixing NDWI definitions without documenting whether the workflow means open water or vegetation liquid water.
- Using indices over clouds, shadows, snow, water, or built surfaces where the formula's assumptions do not hold.
- Ignoring atmospheric correction, sun glint, adjacency effects, bidirectional reflectance, and mixed pixels.
- Using beautiful 3D reconstructions without documenting capture coverage, calibration, control points, positional uncertainty, and blind spots.
Works Cited
"Landsat." NASA Science, National Aeronautics and Space Administration, https://science.nasa.gov/mission/landsat/. Accessed 9 May 2026.
"Landsat 1." NASA Science, National Aeronautics and Space Administration, https://science.nasa.gov/mission/landsat/landsat-1/. Accessed 9 May 2026.
Lillesand, Thomas, Ralph W. Kiefer, and Jonathan Chipman. Remote Sensing and Image Interpretation. 7th ed., Wiley, 2015.
Schonberger, Johannes L., and Jan-Michael Frahm. "Structure-from-Motion Revisited." 2016 IEEE Conference on Computer Vision and Pattern Recognition, IEEE, 2016, pp. 4104-4113.
Kerbl, Bernhard, et al. "3D Gaussian Splatting for Real-Time Radiance Field Rendering." ACM Transactions on Graphics, vol. 42, no. 4, 2023, article 139. https://doi.org/10.1145/3592433.
Gao, Bo-Cai. "NDWI--A Normalized Difference Water Index for Remote Sensing of Vegetation Liquid Water from Space." Remote Sensing of Environment, vol. 58, no. 3, 1996, pp. 257-266. https://doi.org/10.1016/S0034-4257(96)00067-3.
Huete, A. R. "A Soil-Adjusted Vegetation Index (SAVI)." Remote Sensing of Environment, vol. 25, no. 3, 1988, pp. 295-309. https://doi.org/10.1016/0034-4257(88)90106-X.
"Measuring Vegetation (NDVI & EVI)." NASA Earth Observatory, National Aeronautics and Space Administration, https://science.nasa.gov/earth/earth-observatory/measuring-vegetation-ndvi-evi/. Accessed 12 May 2026.
McFeeters, Stuart K. "The Use of the Normalized Difference Water Index (NDWI) in the Delineation of Open Water Features." International Journal of Remote Sensing, vol. 17, no. 7, 1996, pp. 1425-1432. https://doi.org/10.1080/01431169608948714.
"EMIT Spectral Bands." NASA Earthdata, National Aeronautics and Space Administration, https://www.earthdata.nasa.gov/data/instruments/emit-imaging-spectrometer/spectral-bands. Accessed 12 May 2026.
"Landscape Assessment: Ground Measure of Severity, the Composite Burn Index; and Remote Sensing of Severity, the Normalized Burn Ratio." U.S. Geological Survey, https://www.usgs.gov/publications/landscape-assessment-ground-measure-severity-composite-burn-index-and-remote-sensing. Accessed 12 May 2026.
Richards, John A. Remote Sensing Digital Image Analysis. 6th ed., Springer, 2022.
![]()